Kingsley Chimuanya Ukandu

Mathematics.
Disease dynamics.
Data.

I use applied mathematics to understand how population movement shapes infectious-disease dynamics, while extending that work through scientific machine learning and explainable health-data analysis.

Ph.D. Candidate in Mathematical Sciences (Applied Mathematics) · M.S. Student in Data Analytics · University of Nevada, Las Vegas

Formal portrait of Kingsley Chimuanya Ukandu in a gray suit
Applied mathematician · Las Vegas, Nevada

01Ph.D. Candidate at UNLV

022026 SIAM Journal article

033 peer-reviewed journal articles

04M.S. Student in Data Analytics

How the work connects

One question, seen through four analytical lenses.

The methods change, but the thread is consistent: begin with structure, study the dynamics, learn from data without discarding the equations, and make model behavior easier to understand.

01

Structure

Mathematical foundations in differential equations, functional analysis, and optimization.

02

Dynamics

Studying movement, heterogeneity, equilibria, and disease persistence.

03

Inference

Using governing equations to guide machine learning and parameter recovery.

04

Explanation

Understanding how predictive models behave on health-related data.

Flagship research

How does movement change whether a disease fades or persists?

My doctoral work studies connected populations whose local disease conditions differ. Movement can link those local dynamics and change the long-run outcome in ways a single well-mixed population cannot show.

Central question
How can population movement reshape disease persistence across heterogeneous places?
Model family
SIS epidemic network and patch models.
Mathematical focus
Endemic equilibria, persistence, stability, and bifurcation questions.
Published evidence
2026 article in SIAM Journal on Applied Mathematics.

Scientific machine learning

Let the equations help the network learn.

OngoingPhase 1 implementedSynthetic-data experiment

In the current phase, a neural network learns a SIRD epidemic trajectory from synthetic observations while also being penalized when its output violates the governing differential equations.

The objective is controlled parameter recovery—not real-outbreak forecasting. Two-region movement and multipatch SIS versions are planned extensions and have not yet been implemented.
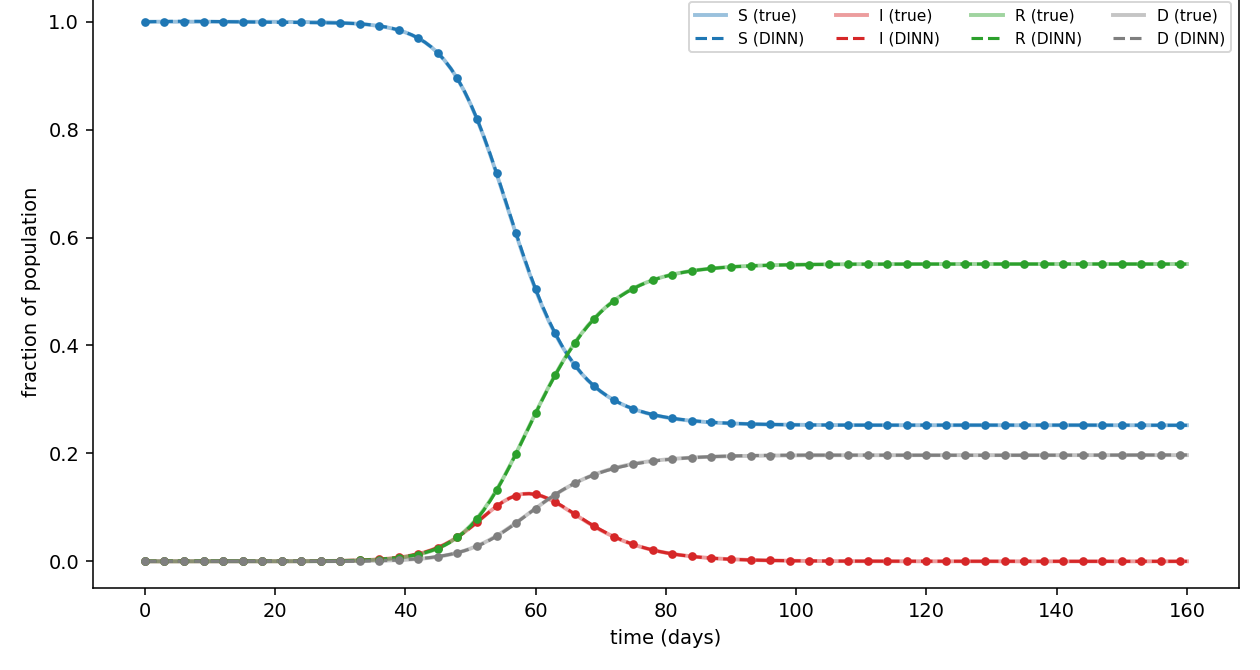
Comparison of synthetic SIRD trajectories and disease-informed neural-network fits over 160 days
Open the SIRD trajectory comparison at full size (opens in a new tab)
Synthetic-data experiment. Solid trajectories show the known SIRD solution; dashed trajectories show the neural-network fit.Reading the figure. The close overlap shows how the current model reproduces the synthetic trajectory in this controlled experiment. It is not evidence of performance on observed outbreak data.

Selected computational projects

From model output to better questions.

Two health-data projects examine what models learn, which errors they make, and why evaluation priorities matter.

01 · Explainable health-data analysis

Explaining mortality-risk predictions in heart failure

Full project title: Toward Precision Medicine: Explaining Mortality Risk Predictions in Heart Failure Patients

Ongoing exploratoryClassification and explainability phase completeSurvival analysis planned

Question. What drives the fitted classifier’s output, and what can its errors reveal?

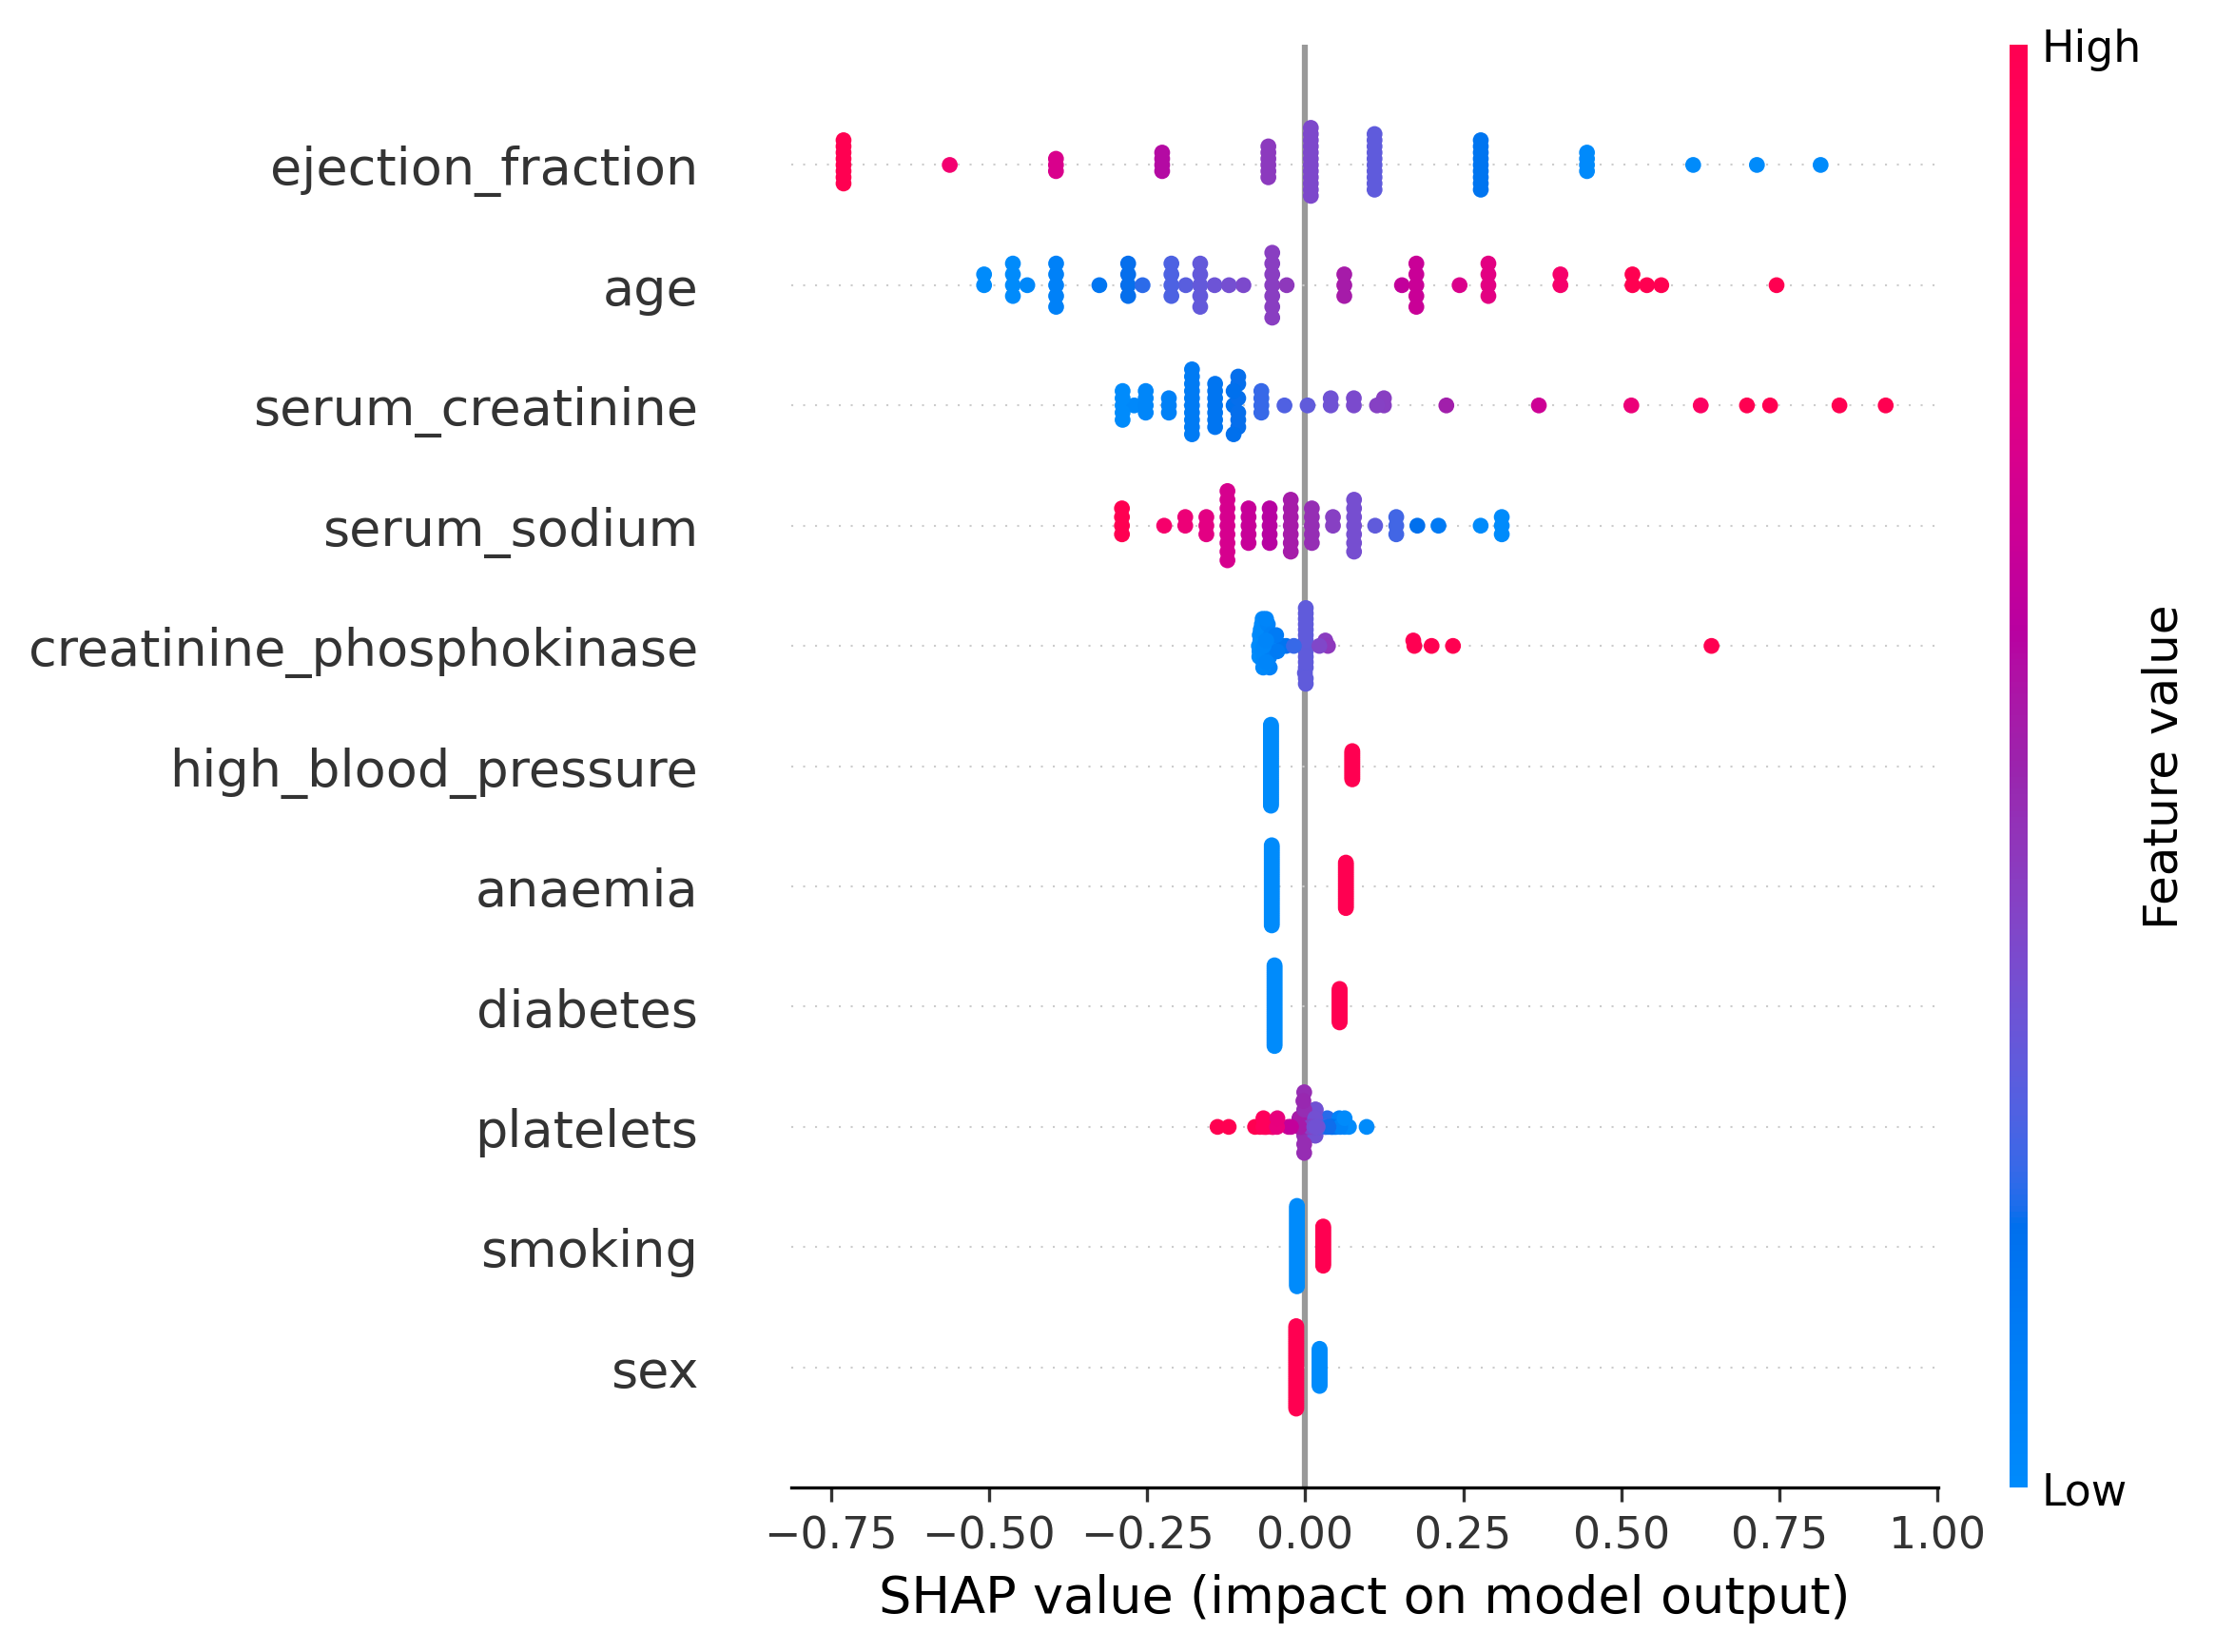
Evidence. On the public 299-record, 13-variable dataset, follow-up time was excluded from the classification features, five classifiers were evaluated, and SHAP was then used to inspect selected fitted models.

Limitation. SHAP describes model behavior, not causality; the work is not clinically or prospectively validated.

Explore the case study
SHAP beeswarm showing how feature values shift a tuned logistic-regression model output for heart-failure records
Open the logistic-regression SHAP summary at full size (opens in a new tab)
Tuned logistic regression · Global SHAP summary for the exploratory classification analysis.Reading the figure. Each point is one record. Horizontal position shows a contribution to the fitted model output, not a causal or clinically validated effect.

02 · DA 622 Course Project · Completed January–May 2026

The recall–precision tradeoff in heart-disease severity

Full project title: Predicting Heart Disease Severity: A Machine Learning Analysis of the UCI Heart Disease Dataset

Course projectUCI Heart Disease Dataset

Question. Which model is preferable when missing severe cases carries a different cost from raising false severe-case flags?

Evidence. Among three compared models, weighted XGBoost reached 74.1% severe-class recall with 33.9% precision—showing why the preferred model depends on which errors matter.

Limitation. This is a course-based benchmark analysis, not a clinically validated decision system.

Explore the comparison

Weighted XGBoost · severe class

74.1% recall33.9% precision
Higher severe-case detection, with more false severe-case flags.

Publications & talks

Research in print and in conversation.

A published contribution at the center of the dissertation direction, alongside recent moments where the work has been tested through discussion.

Featured article · 2026

Complex structure in the endemic equilibrium set of an SIS epidemic patch model with the mass-action infection mechanism.

Rachidi B. Salako & Kingsley Chimuanya Ukandu · SIAM Journal on Applied Mathematics, 86(2), 644–674Read the article (opens in a new tab)

Population Movement and Endemic Persistence in SIS Epidemic Network Models

ICM@ICM 2026 satellite conference · Oral presentation

Effects of Population Movement on the Long-Term Dynamics of Infectious Diseases in SIS Epidemic Network Models

UNLV Seminar on Partial Differential Equations and Related Topics

View all publications & talks

Teaching & leadership

The work around the work.

Teaching develops mathematical judgment in the classroom; leadership helps build the community in which that judgment can grow.

Teaching

Mathematics from calculus to real analysis.

Across nine academic terms at UNLV, I completed 33 official course-section assignments representing 814 aggregate term enrollments. The record spans Calculus I–III, Differential Equations I, and jointly scheduled undergraduate/graduate Real Analysis I–II, including a Summer 2024 Calculus II lecture assignment.

814 is a sum of section-level term enrollments, not a count of unique students.

9
academic terms
33
official course-section assignments
814
aggregate term enrollments

President · Society for Black Scientists

Community, professional development, and STEM service.

During the 2024–2025 academic year, I served as President of the Society for Black Scientists at UNLV’s College of Sciences, supporting professional development through a yearly seminar series, conference opportunities for selected presenters, and student–faculty networking.

Academic Year2024–2025
Explore the full teaching & leadership record

Selected recognition

Support for research and study.

2025–2026

Wolzinger Family Research Scholarship

2023–2024 & 2024–2025

Graduate Registered Student Organization Awards

2024–2025

Sciences General Scholarship

Beyond the equations

The work has a quieter counterpart.

Step beyond the research for a few quieter notes on nature, walking, movies, travel, and the new technologies that keep me curious.

Meet me beyond the mathematics