Project case study · Explainable health-data analysis
Explaining what drives a model’s mortality-risk output.
Toward Precision Medicine: Explaining Mortality Risk Predictions in Heart Failure Patients
A classifier can produce a score. What is pushing that output up or down?
Aggregate performance does not explain how the model behaves for an individual record, or where that behavior breaks down. This project pairs model comparison with SHAP explanations and error analysis.
A consequential feature decision
Follow-up time was excluded from classification.
The dataset includes a time variable that records follow-up duration. Using it as a classification feature risks giving the model information entangled with how long a patient was observed. I excluded it from the classifier inputs to reduce leakage risk.
Clinical and demographic variables used in the exploratory classification setup.
ExcludedFollow-up time as a classification feature.
OutcomeDeath-event label used for the binary classification analysis.
Global model behavior
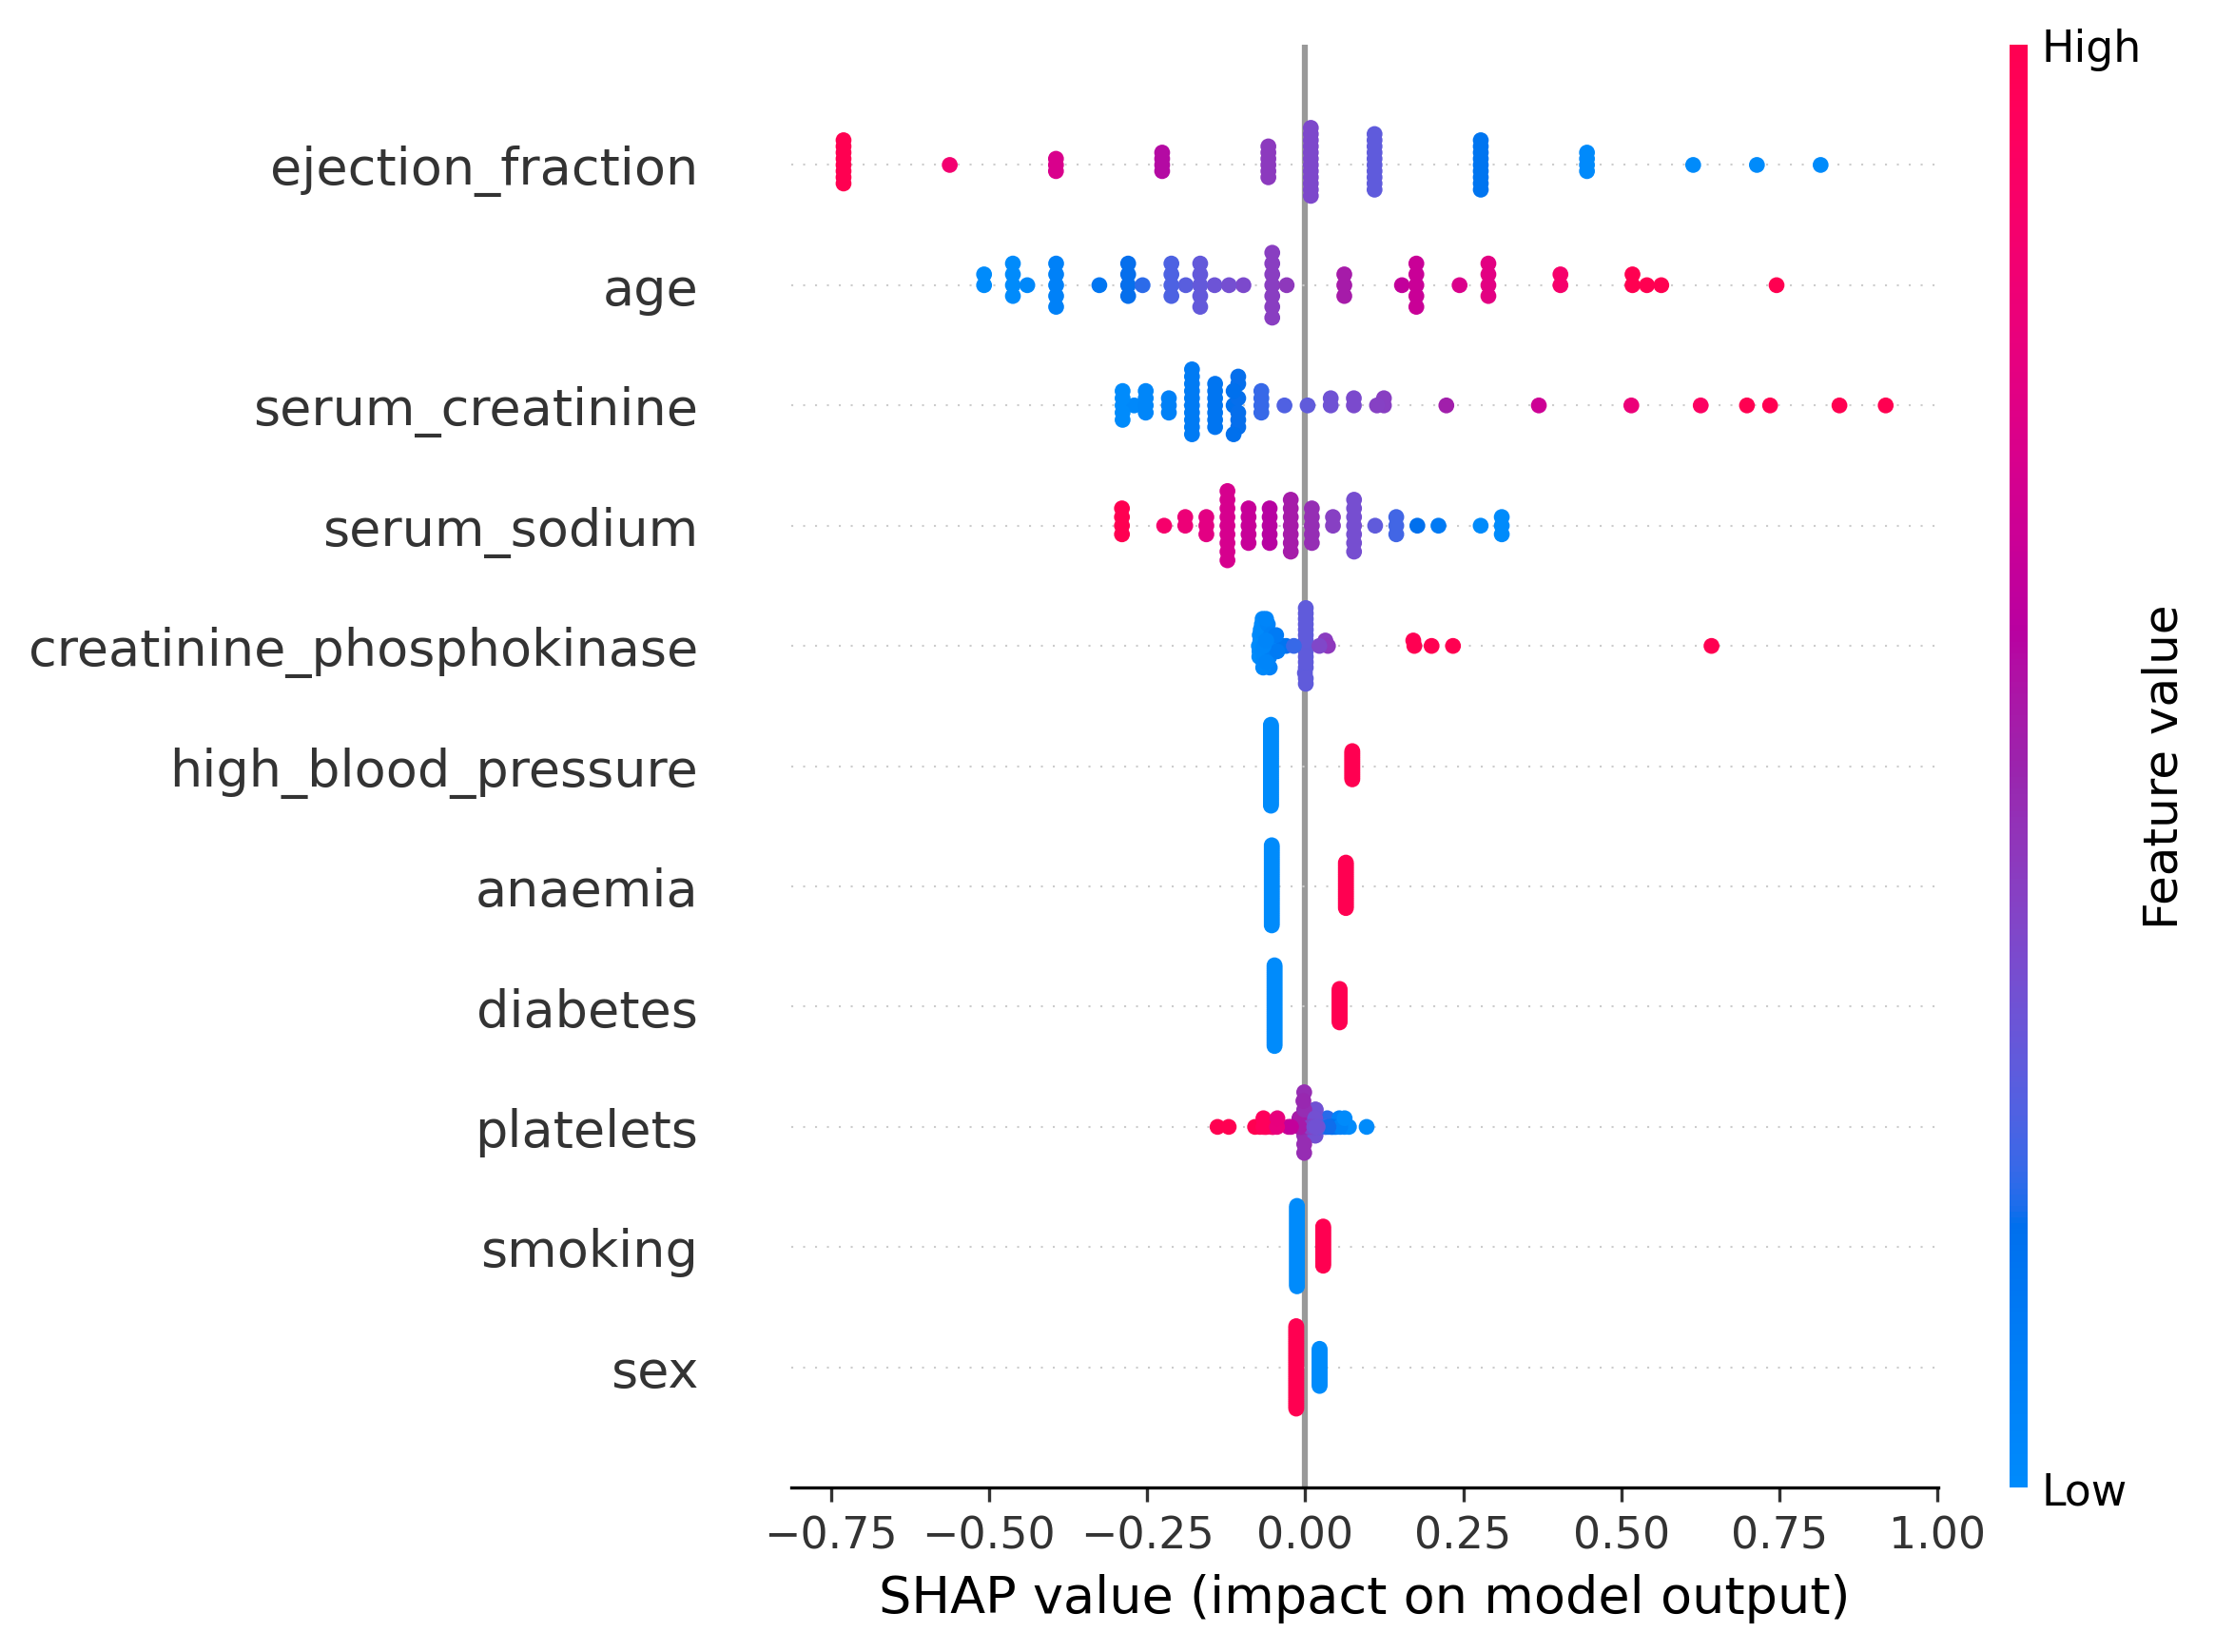
SHAP shows how each feature shifts the fitted model output.
Each point represents a record. Its horizontal position indicates whether that feature value pushes the model output higher or lower relative to its reference value. Color shows whether the observed feature value is relatively high or low.
Important: these are model attributions. They are not causal effects, clinical recommendations, or proof of a valid patient-care risk estimate.
Individual explanations
Three illustrative records. None is a global extreme.
These examples were selected to show a true positive, true negative, and false positive. They should not be described as the dataset’s highest-risk, lowest-risk, or otherwise globally selected cases.
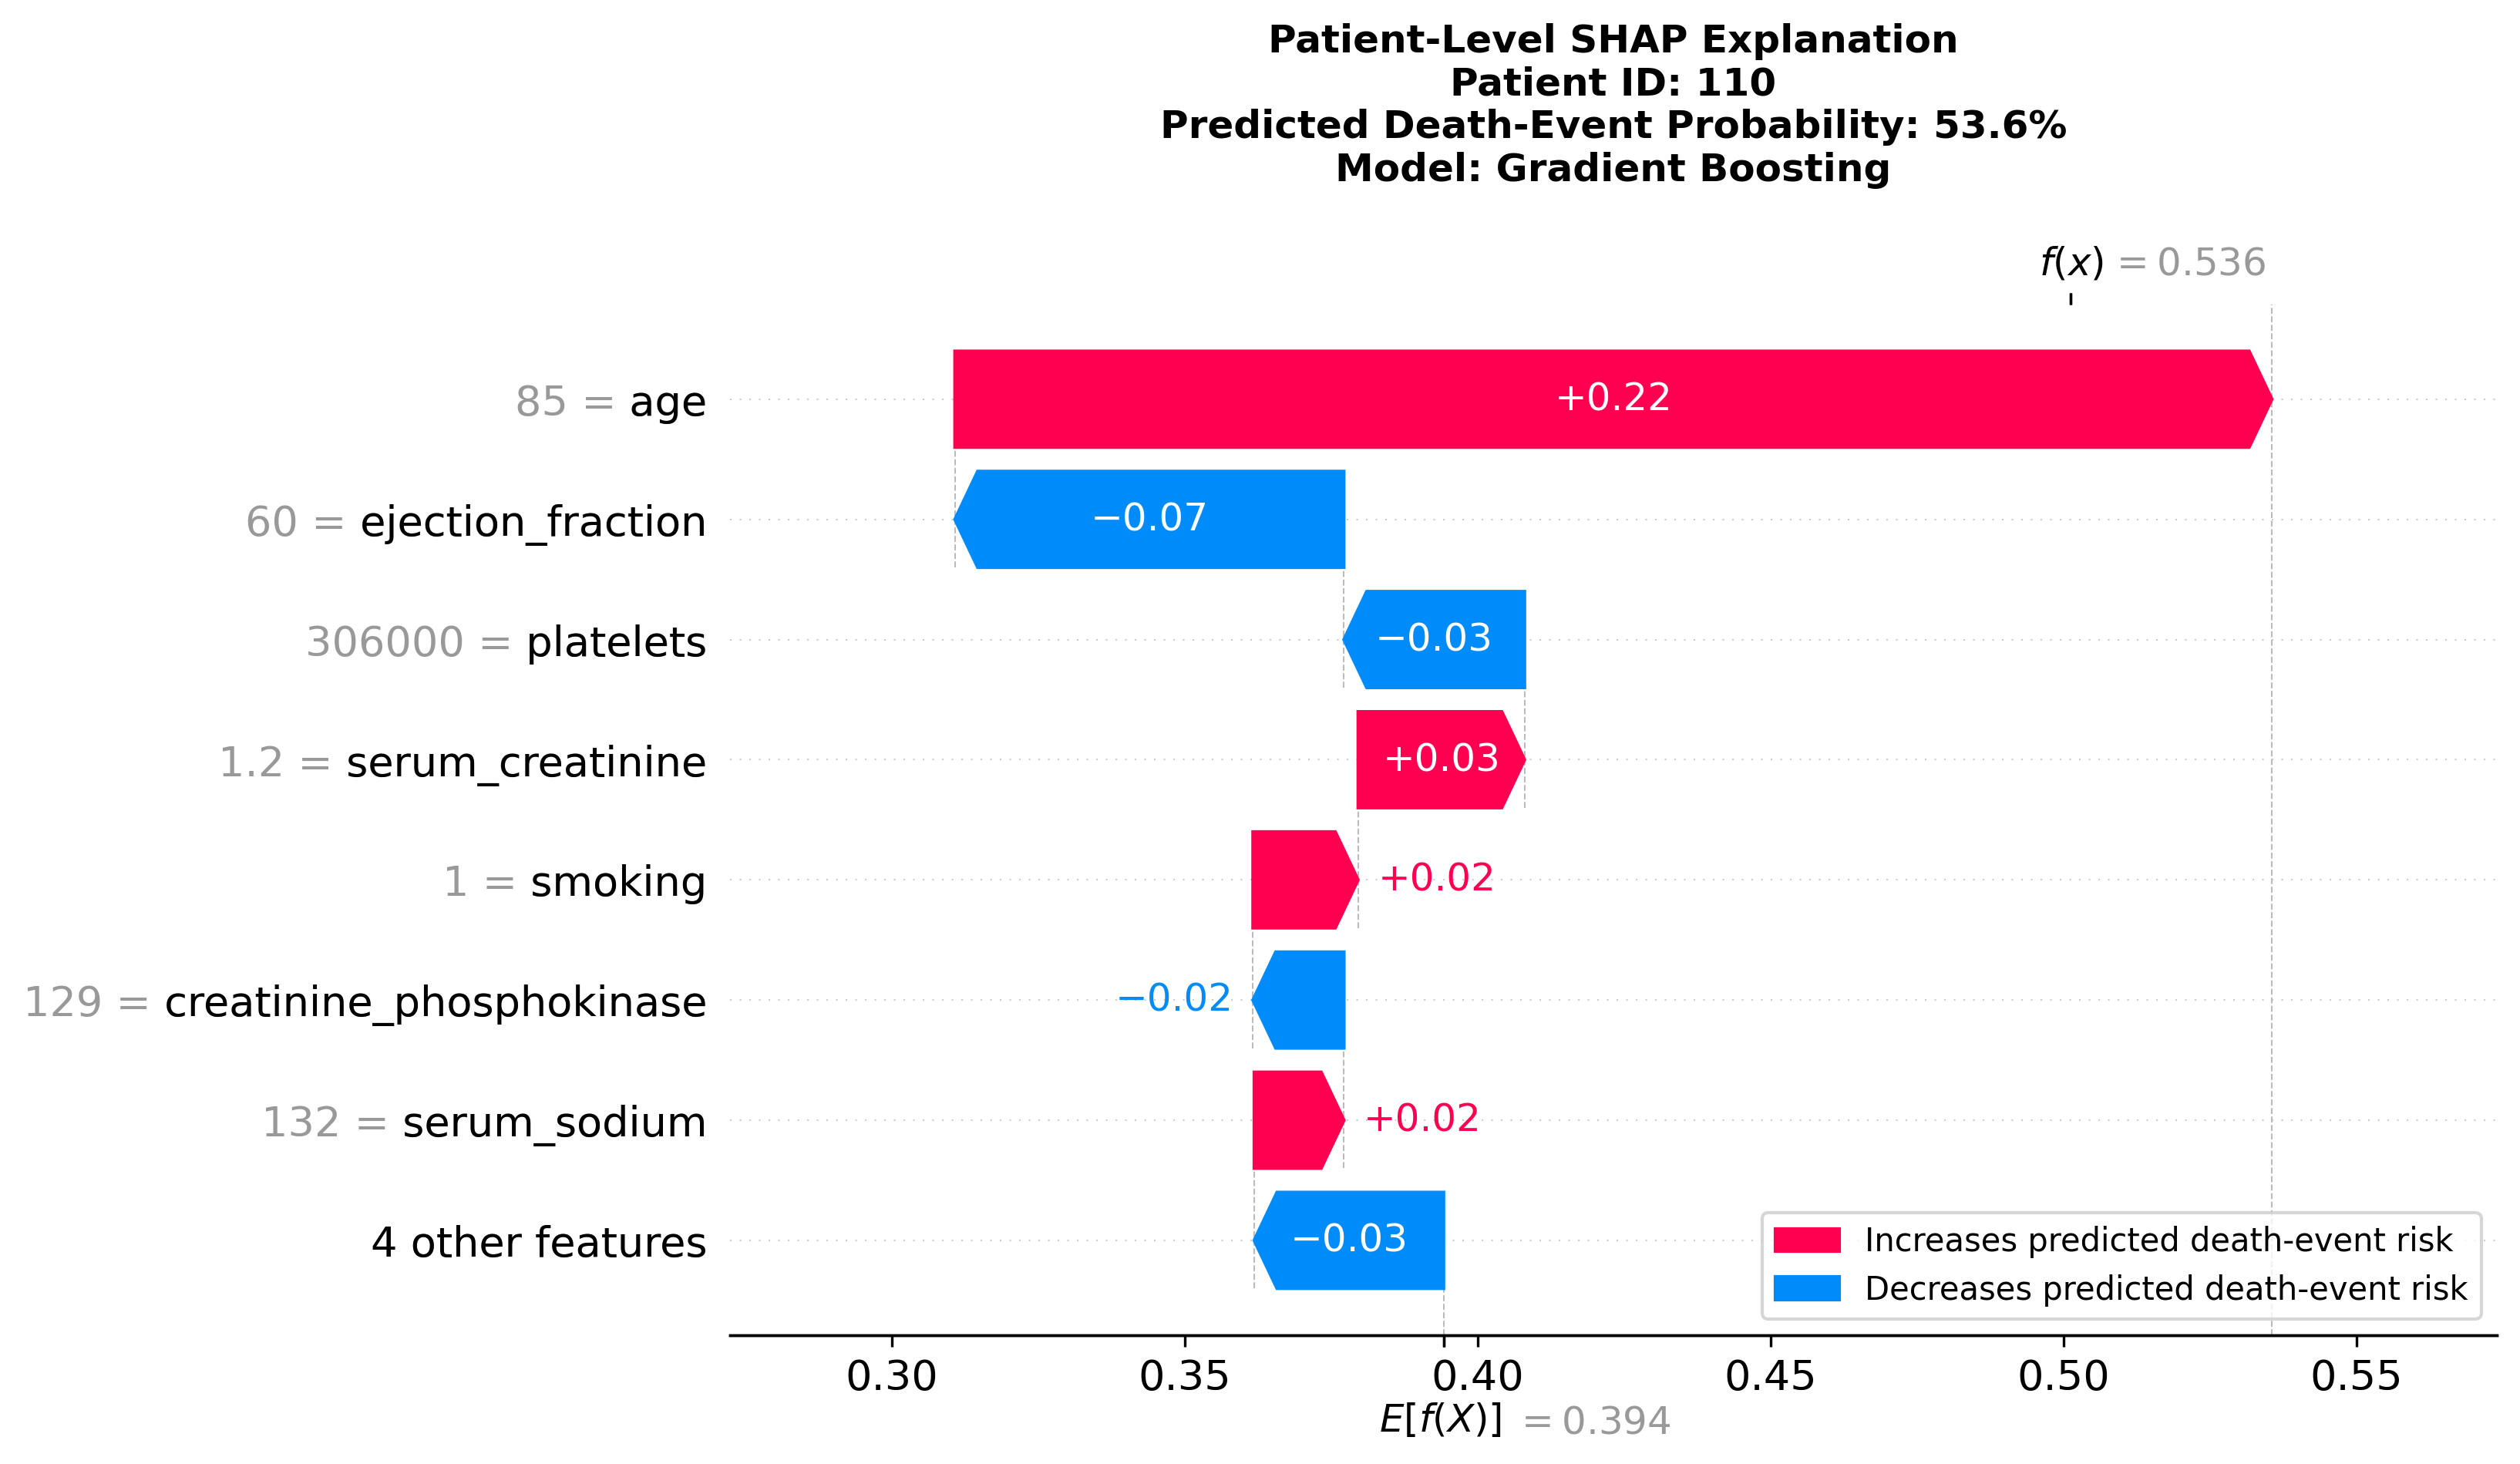
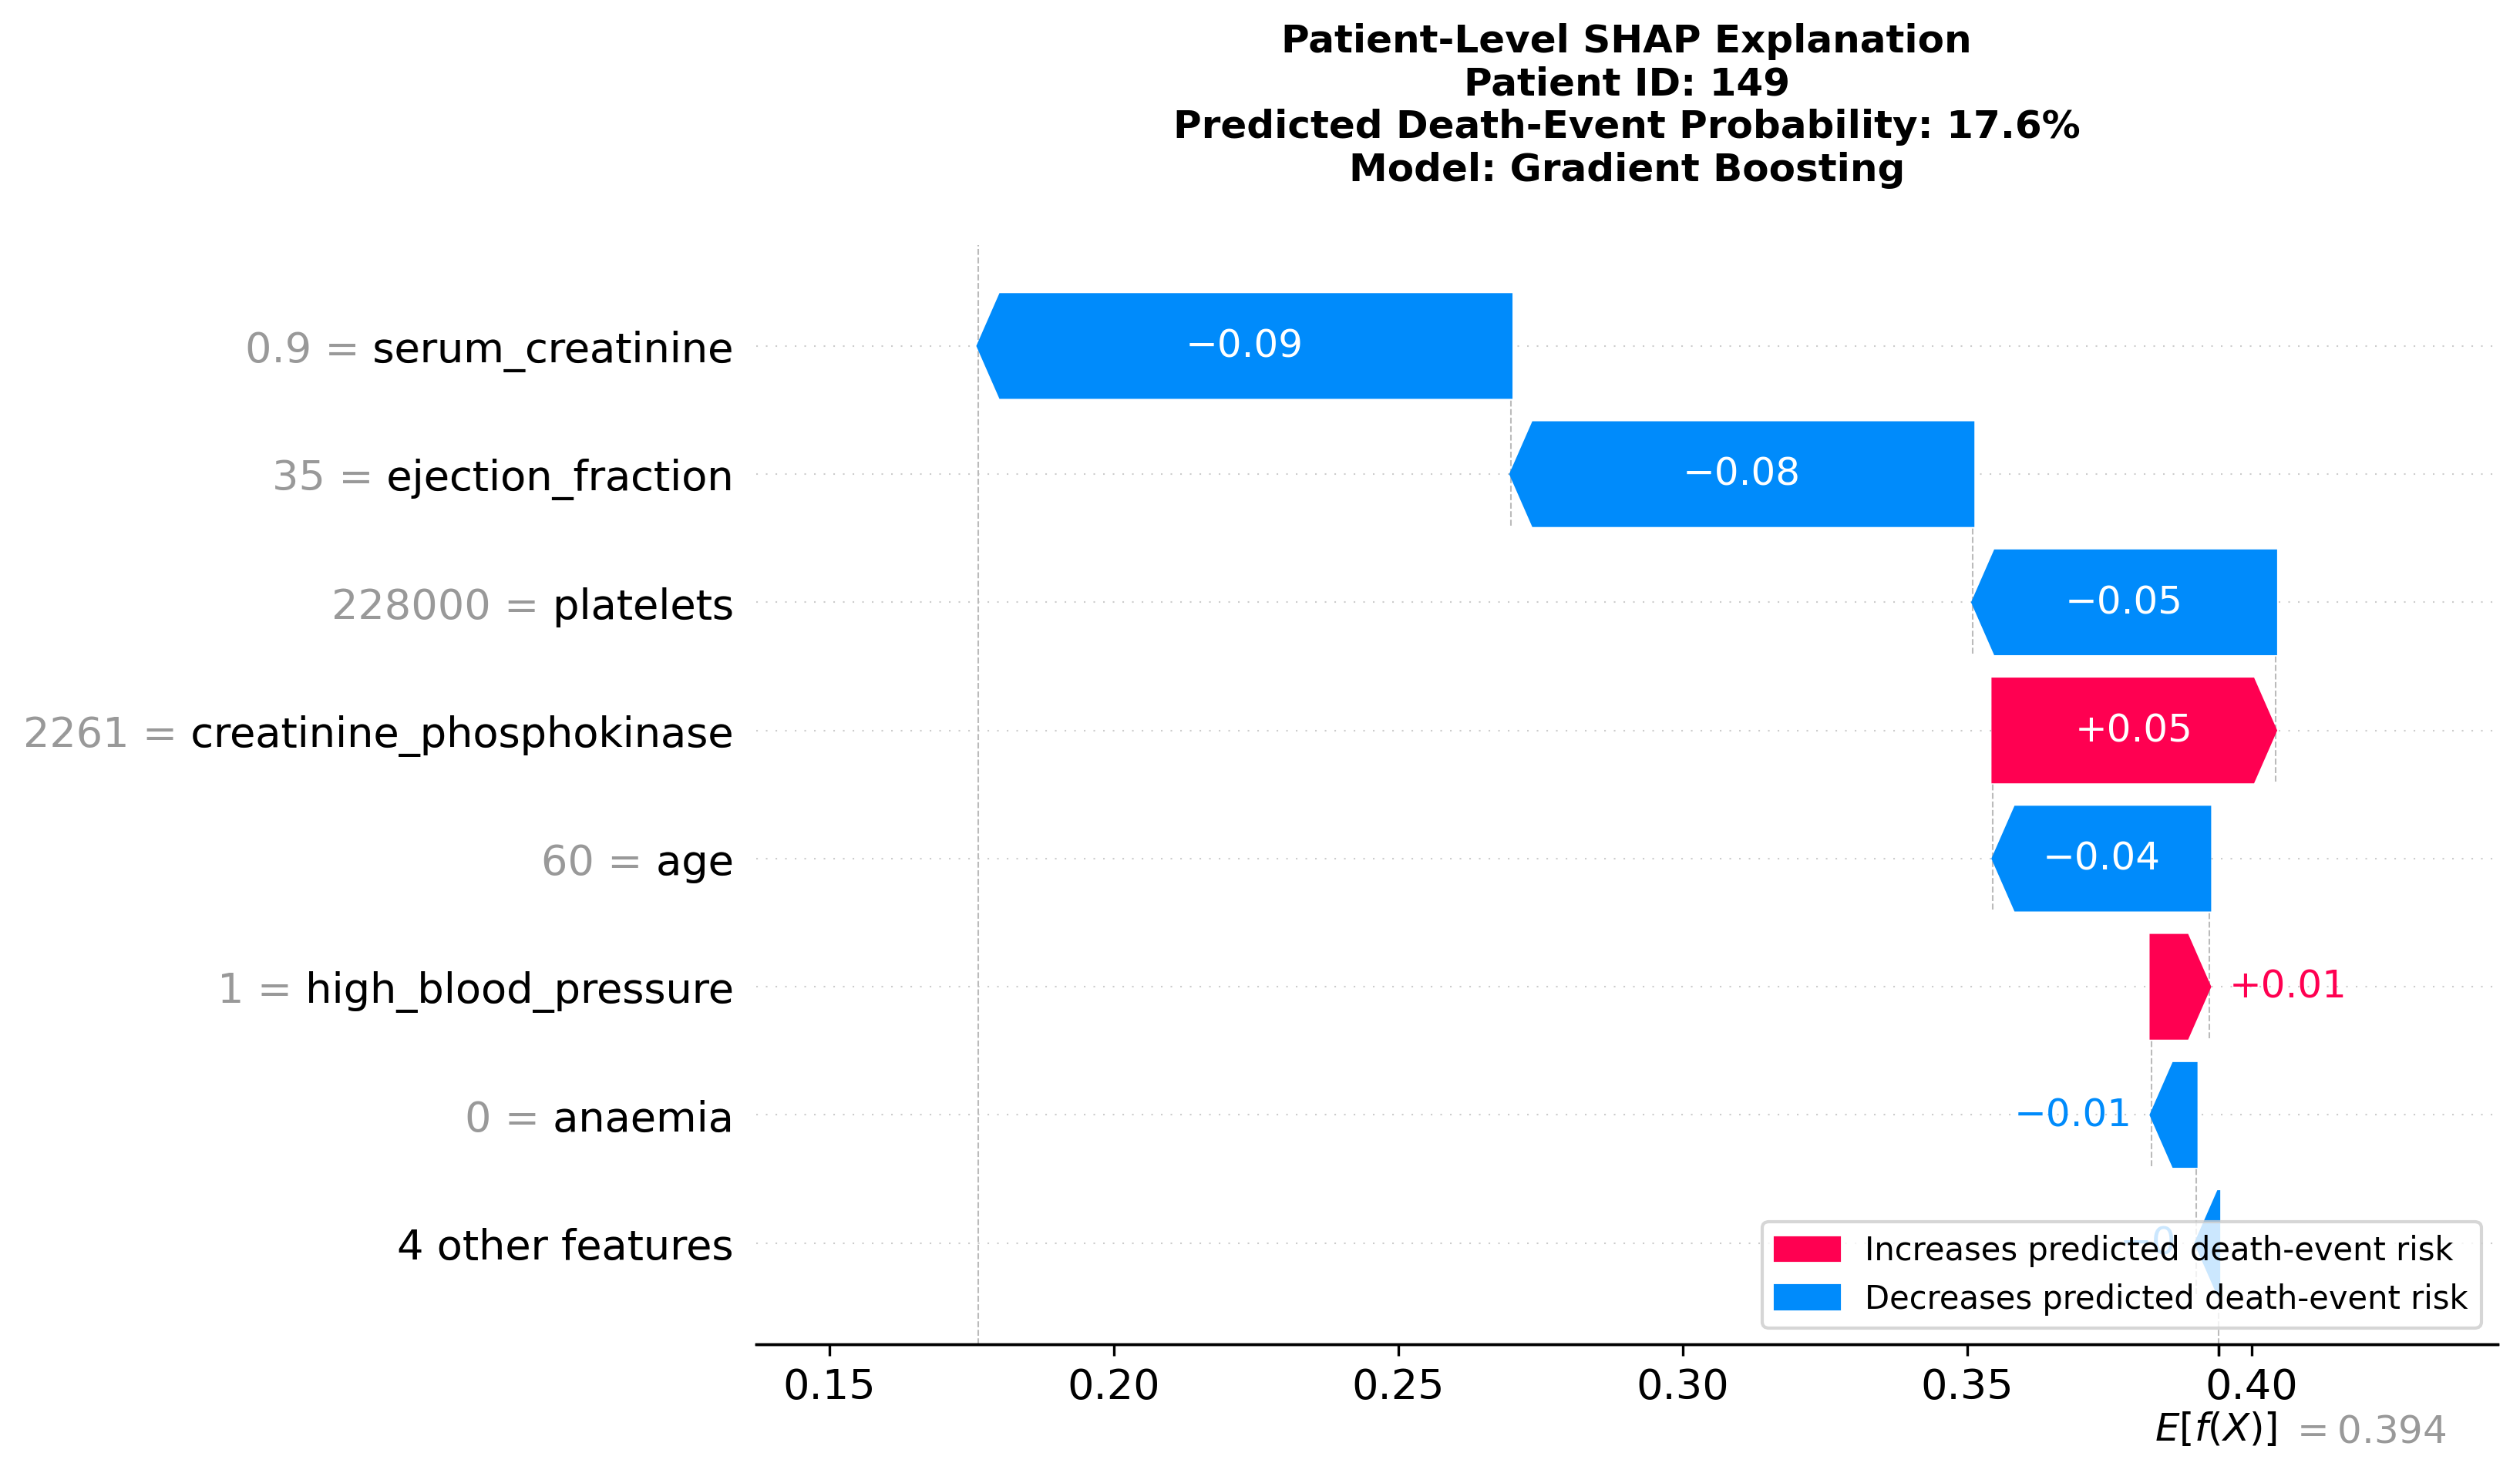
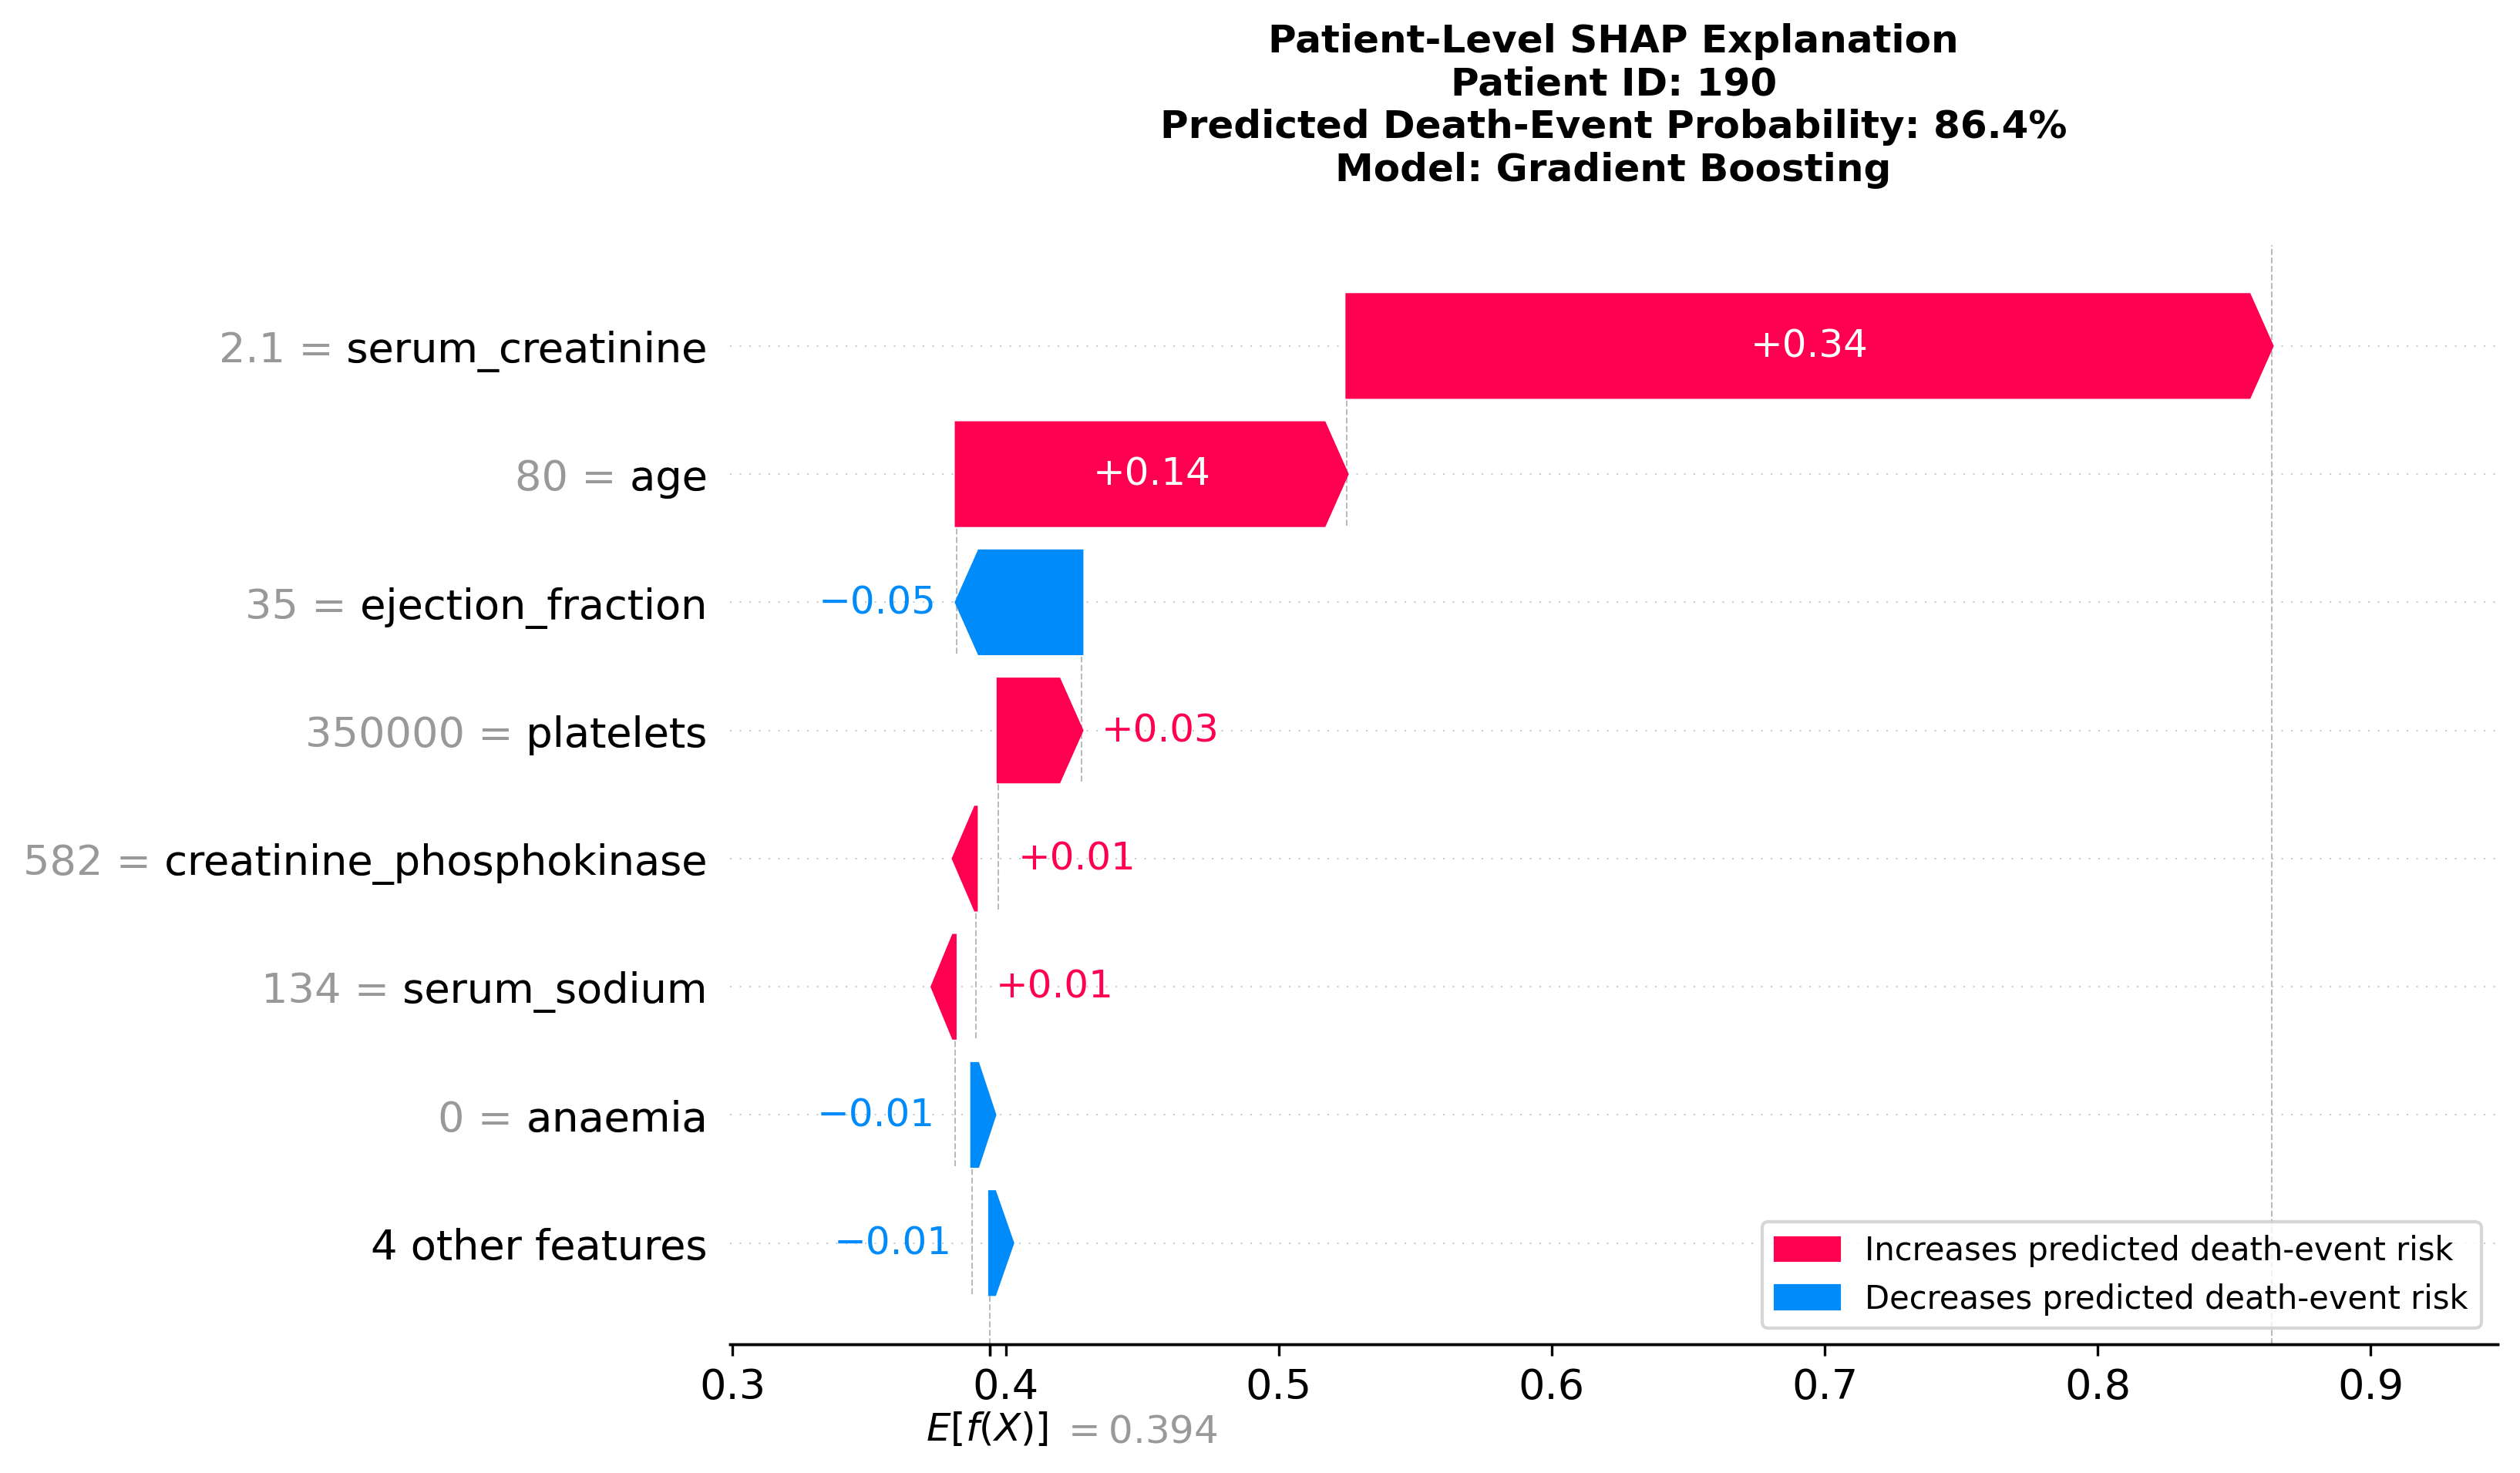
The source waterfall graphics use “probability” in their embedded titles. On this site, those values are treated as classifier model outputs—not as calibrated clinical risk probabilities.
Why the false positive matters
An explanation can be internally clear and still explain a mistake.
The false-positive waterfall assigns understandable contributions to the record’s features. That does not rescue the prediction. It gives a better view of why the fitted model crossed its decision threshold on this example—and a concrete place to ask whether the learned pattern is stable, biased, or too sensitive.
This is the practical value of explainability here: not a certificate of trust, but a way to inspect model behavior and its failures more closely.
Current status
The classification and explainability phase is complete.
The project currently covers exploratory preprocessing, classifier comparison, global SHAP analysis, and individual error examples. Survival analysis is planned as a later phase and is not represented as completed work.